
User Activity Heatmap Generator with HTML, CSS & JavaScript
40 DAYS 40 PROJECT CHALLENGE
Day #23
Project Overview
The User Activity Heatmap Generator is a beginner-friendly web application built with HTML, CSS, and JavaScript. It visualizes user activity data in a heatmap-style grid, allowing users to understand activity levels through different shades of color. The project focuses on data mapping, grid layouts, and visual representation.
The application takes activity values and maps them to individual cells in the heatmap. JavaScript dynamically creates these cells and applies different styles based on the activity level. Therefore, this project provides practical experience with arrays, loops, DOM manipulation, CSS Grid, and data visualization.
Key Features
- Activity Data Input: Users can provide activity values that the application uses to create the heatmap. JavaScript processes these values and converts them into visual cells.
- Activity Heatmap: The project represents user activity through a grid of cells. Each cell visually indicates the activity level for a particular data point.
- Activity-Based Colors: Different activity values receive different visual styles. As a result, users can quickly distinguish between lower and higher activity levels.
- Dynamic Grid Generation: JavaScript creates the heatmap cells dynamically instead of requiring every cell to be written manually in HTML.
- Data Mapping: The application maps each activity value to a corresponding grid cell. Therefore, the visual layout directly represents the provided data.
- CSS Grid Layout: CSS Grid organizes the activity cells into rows and columns. This creates the structured appearance normally associated with a heatmap.
- Dynamic DOM Updates: JavaScript inserts the generated cells into the heatmap container. Consequently, the visualization can be updated without reloading the page.
- Visual Data Representation: Instead of displaying activity values only as numbers, the project converts them into a visual pattern. This makes activity differences easier to identify.
- Simple Interface: The project uses a clean layout with a heading and heatmap area. As a result, the visualization remains easy to understand for beginners.
- Responsive Structure: The heatmap uses a grid-based layout that can adapt to the available space. Therefore, the project can work across different screen sizes.
What You'll Learn
- How to create a user activity heatmap using HTML, CSS, and JavaScript.
- How to store and process activity data using JavaScript arrays.
- How to use loops to generate multiple elements dynamically.
- How to map data values to visual styles.
- How to create grid layouts using CSS Grid.
- How to generate and update DOM elements dynamically.
- How to represent numerical data visually.
- How to build a simple data visualization interface.
HTML Code
HTML creates the basic structure of the User Activity Heatmap Generator. The main container holds the project heading and the element where JavaScript generates the heatmap.
The heatmap container provides an empty area for the activity cells. JavaScript later selects this element and inserts the required cells based on the activity data. Therefore, the HTML remains simple while JavaScript handles most of the dynamic visualization.
<!DOCTYPE html>
<html>
<head>
<meta charset="UTF-8">
<title>User Activity Heatmap</title>
<link rel="stylesheet" href="style.css">
</head>

<body>

<div class="container">

<h1>User Activity Heatmap</h1>

<input id="activityData" placeholder="Enter activity values (e.g. 2,5,8,1,0,6,9,3)">

<button onclick="generateHeatmap()">Generate Heatmap</button>

<div id="heatmap"></div>

</div>

<script src="script.js"></script>

</body>
</html>
CSS Code
CSS controls the appearance and layout of the heatmap. First, the universal selector resets the default margin and padding and applies box-sizing: border-box. The main page uses a centered layout with a clean background and spacing around the content. Meanwhile, the heatmap container uses CSS Grid to arrange the activity cells into rows and columns.
Each activity cell has a fixed size, spacing, and visual styling. In addition, different activity levels use different background shades. As a result, users can identify activity patterns by looking at the heatmap. Finally, the grid structure keeps the cells organized and allows the visualization to remain readable on different screen sizes.
*{
margin:0;
padding:0;
box-sizing:border-box;
font-family:Arial;
}

body{
background:#042354;
display:flex;
justify-content:center;
align-items:center;
height:100vh;
}

.container{
background:white;
padding:30px;
border-radius:12px;
width:600px;
text-align:center;
}

input{
width:100%;
padding:10px;
margin:10px 0;
border-radius:6px;
border:1px solid #ddd;
}

button{
width:100%;
padding:12px;
background:#2563eb;
border:none;
color:white;
border-radius:6px;
cursor:pointer;
}

button:hover{
background:#1d4ed8;
}

#heatmap{
display:grid;
grid-template-columns:repeat(7,1fr);
gap:5px;
margin-top:20px;
}

.cell{
width:60px;
height:60px;
border-radius:6px;
}
Javascript Code
JavaScript handles the activity data and generates the heatmap. First, the code stores the activity values in an array and selects the heatmap container from the HTML. Next, JavaScript loops through the activity data and creates a new cell for each value. It then uses the activity level to determine the appropriate visual style for that cell.
After that, the generated cell is added to the heatmap container using DOM methods. Therefore, JavaScript can create the complete grid without manually writing every cell in HTML. Finally, the application displays the activity data as a visual heatmap. As a result, users can identify different activity levels by comparing the shades of the generated cells.
function generateHeatmap(){

const data = document.getElementById("activityData").value
.split(",")
.map(Number)

const container = document.getElementById("heatmap")

container.innerHTML=""

data.forEach(value => {

const cell = document.createElement("div")

cell.className = "cell"

let color

if(value === 0){
color = "#e5e7eb"
}
else if(value < 3){
color = "#bfdbfe"
}
else if(value < 6){
color = "#60a5fa"
}
else if(value < 9){
color = "#2563eb"
}
else{
color = "#1e3a8a"
}

cell.style.background = color

container.appendChild(cell)

})

}Related Projects

Day 20 : AI Chatbot Widget for Website
Interactive chatbot UI for handling user queries in real-time.
Concepts: Event handling, dynamic responses, UI interaction.
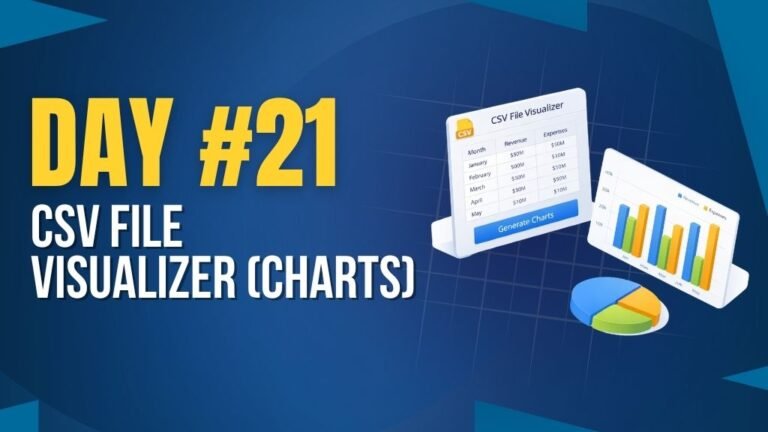
Day 21 : CSV File Visualizer (Charts)
Uploads CSV files and displays data using interactive charts.
Concepts: File handling, data parsing, chart rendering.

Day 25 : Expense Analytics Dashboard
Tracks and visualizes expenses with charts and category breakdowns.
Concepts: Data visualization, state management, dynamic rendering.